

Guide Contents 📖
1. Introduction to the Study
In response to the growing challenges of energy efficiency, driven by both new regulations and potential financial savings, Sinteo leverages energy and carbon data from energy audits of commercial and residential buildings through our new internal tool.
Our internal benchmark is not limited to merely collecting overall building energy consumption; it also considers all factors influencing the building's energy and carbon performance (year of construction, typology, equipment types, etc.) and allows for analysis of consumption by category (HVAC, lighting, domestic hot water, etc.).
Key Applications

Evaluating a building's average consumption
According to its construction/renovation date, location, equipment, etc.

Understanding consumption by category
Heating, air conditioning, ventilation, lighting, office automation, servers, etc.

Comparing consumption data
According to various criteria such as typology: residential, offices, hotels
2. Key Takeaways from the Benchmark – Key Figures – Focus on Office Buildings
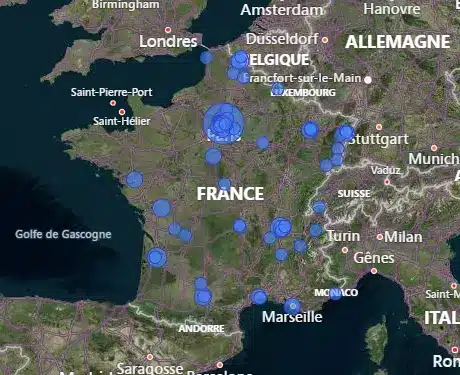
This blog post therefore focuses on data related to office buildings, representing 205 assets to date, distributed across metropolitan France.
2.1 -> Consumption Breakdown by Category
Figure 1: Consumption Breakdown by Category – Offices – All Years Combined (in kWhFE/m²)
Analysis
Unsurprisingly, heating is the largest consumption category in office buildings. It accounts for an average of 34% of a site's consumption, at 56 kWh/m² (all energy types combined).
Consequently, the most significant energy saving potentials are generally found in this category. This involves, first, energy sobriety actions (optimized setpoint temperatures, adapted time schedules, etc.), followed by energy efficiency actions (installation of heat pumps, insulation of networks and building envelope, heat recovery via double-flow ventilation, proper equipment regulation, etc.).
However, to achieve significant energy savings, comprehensive renovation proves considerably more effective than fragmented improvements.
Air conditioning is the second largest consumption category, representing an average of 12% of an office building's consumption. This category is expected to increase due to climate change and the already observed undersizing in some buildings.
Beyond its consumption, air conditioning impacts urban temperature increases (due to hot air discharge outdoors) and the potential release of refrigerants with high global warming potential into the atmosphere.
> Discover our CRREM blog post
Lighting ranks third, accounting for an average of 11% of consumption. Luminaires in tertiary assets are progressively being replaced by LED technology, which is currently the least energy-consuming option. Effective lighting management can also generate savings (presence detection for intermittently occupied spaces, scheduled switch-off times, etc.).
Office IT equipment accounts for an average of 10% of total consumption. It is crucial not to underestimate the energy consumed by computers and other equipment in standby mode.
HVAC auxiliaries (Heating, Ventilation, Air Conditioning), encompassing circulation pumps and emitters (fan coil units, cassettes, etc.), represent an average of 9% of total consumption. Their usage is directly correlated with the operation of heating and air conditioning systems within a building.
Ventilation systems, covering the consumption of sanitary exhaust fans and office Air Handling Units (AHUs), account for an average of 8% of total consumption. In cases of poorly adjusted air renewal rates, an AHU can generate substantial energy consumption from fans and thermal losses (due to air renewal). An efficient double-flow ventilation system with heat recovery significantly reduces heating consumption.
For a more detailed analysis, the benchmark also enables the comparison of consumption categories based on their construction year.
2.2 -> Evolution of Consumption by Category
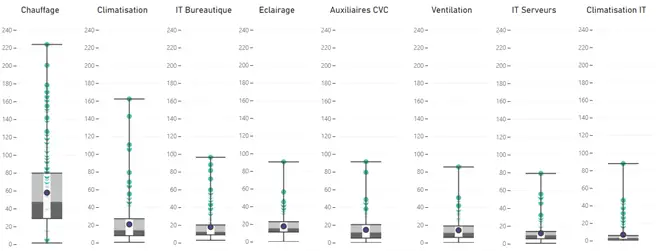
The graph above represents each building as a point, allowing for the distinction of differences between them. Consumption related to heating or air conditioning categories varies considerably from one building to another, due to different production systems (boiler, heat pump, Joule effect, etc.) as well as variations caused by regulation (presence of a BMS/CMMS, absence of regulation, etc.).
This variability underscores the importance of energy audits to identify the specific characteristics of each building.
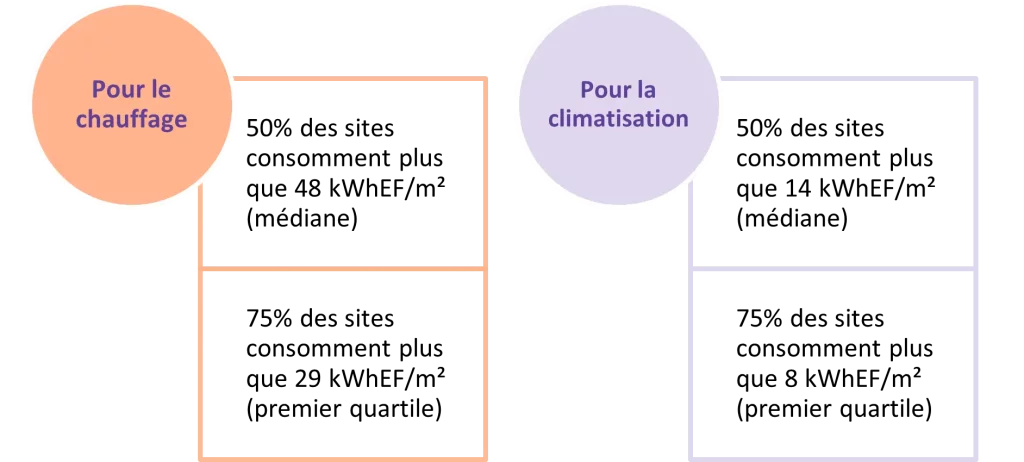
When analyzing the graph across all years, it is observed that:
- For heating
- For air conditioning
Median at 85 kWh/m²
2nd highest consumer: 2000s offices
Median at 49 kWh/m²
3rd highest consumer: 2010-2020s offices
Median at 30 kWh/m²
These results indicate a downward trend in heating energy consumption for more recent constructions. This can be attributed to improvements in equipment performance and building insulation over the years, driven by thermal regulations. This trend is expected to continue with the RE 2020 regulation.
Median at 17 kWh/m²
2nd highest consumer: Haussmannian offices
Median at 15 kWh/m²
3rd highest consumer: 2010-2020s offices
Median at 14 kWh/m²
Conversely, for air conditioning, 2000s offices consume slightly more than other typologies. This can be explained by the superior thermal inertia of Haussmannian buildings and the significant glazed surface area of 2000s offices.
2.3 -> Comparison of Different Energy Types Used
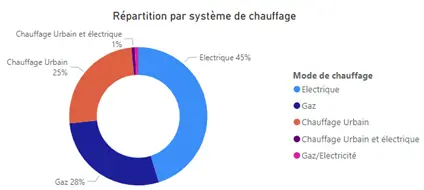
These data should be contextualized by the location of the assets audited during the campaigns, many of which are situated in Ile-de-France, where urban networks are extensively deployed. Indeed, according to the SDES, France's Energy Balance, commercialized heat accounted for only 4% of tertiary sector energy consumption in 2022.
Sources:
– Electricity/Gas: Methodological decree of April 10, 2020, published under the Tertiary Eco-Energy scheme
– Urban heating and cooling networks: Decree of March 16, 2023, taking into account values from the "CO2 Content "LCA" (also known as "Location Based") column.
Depending on the audited sites, feasibility studies, and regulations, various heating systems may be recommended, primarily the installation of heat pumps or connection to the district heating network.

Regulatory Reminders
If an asset is located in a priority development zone, connection to the district heating network is mandatory for significant renovation works on production systems, although derogations are possible. This provision is enshrined in the Energy Code.
Urban networks, their technical characteristics, and priority development zones are listed on the France Chaleur Urbaine website.
3. In Conclusion
The analysis of consumption by category provides a basis for identifying opportunities for improvement and energy savings. Benchmark results reveal trends that can guide strategic decisions regarding renovation and the optimization of energy systems.
This substantial wealth of collected data will enable us, in the future, to conduct further analyses that will, in turn, consider geography, carbon impact, and a multitude of other factors.
To be continued…
4. Glossary
HVAC Auxiliaries: HVAC (Heating, Ventilation, and Air Conditioning) auxiliaries are secondary equipment that contribute to the operation of main HVAC systems. HVAC auxiliaries include fans, pumps, and other equipment that support the functioning of heating, ventilation, and air conditioning systems, without being the primary components. Their role is essential for ensuring air and fluid circulation, as well as the control of HVAC systems.
Primary Energy: « Primary energy refers to all untransformed energy products, directly exploited or imported. These primarily include crude oil, oil shale, natural gas, solid mineral fuels, biomass, solar radiation, hydraulic energy, wind energy, geothermal energy, and energy derived from uranium fission. » INSEE definition
Final Energy: « Final or available energy is the energy delivered to the consumer for their final consumption (gasoline at the pump, electricity at home…). Energy suppliers base their invoices on this. » INSEE definition
Thermal Inertia: The thermal inertia of a building is its capacity to store and release heat in a delayed manner. It primarily depends on the mass and thermal properties of the materials used in construction.
RIE: Company Canteen